Reporting & attribution
.avif)
Closing the Loop
Out-of-home advertising has a long-standing measurement problem. Brands could see a wrapped vehicle on the street, but connecting that exposure to an actual business outcome was nearly impossible. Campaigns ran on estimated impressions and gut feel, which made OOH a hard sell next to channels with built-in analytics.
We built our reporting platform to close that gap. Every Wrapped Media campaign generates exposure data down to the route and the zone, and that data connects to real downstream outcomes — store traffic, website behaviour, and audience insight. OOH stops being a black box and starts behaving like a channel you can actually optimize.

from street to screen
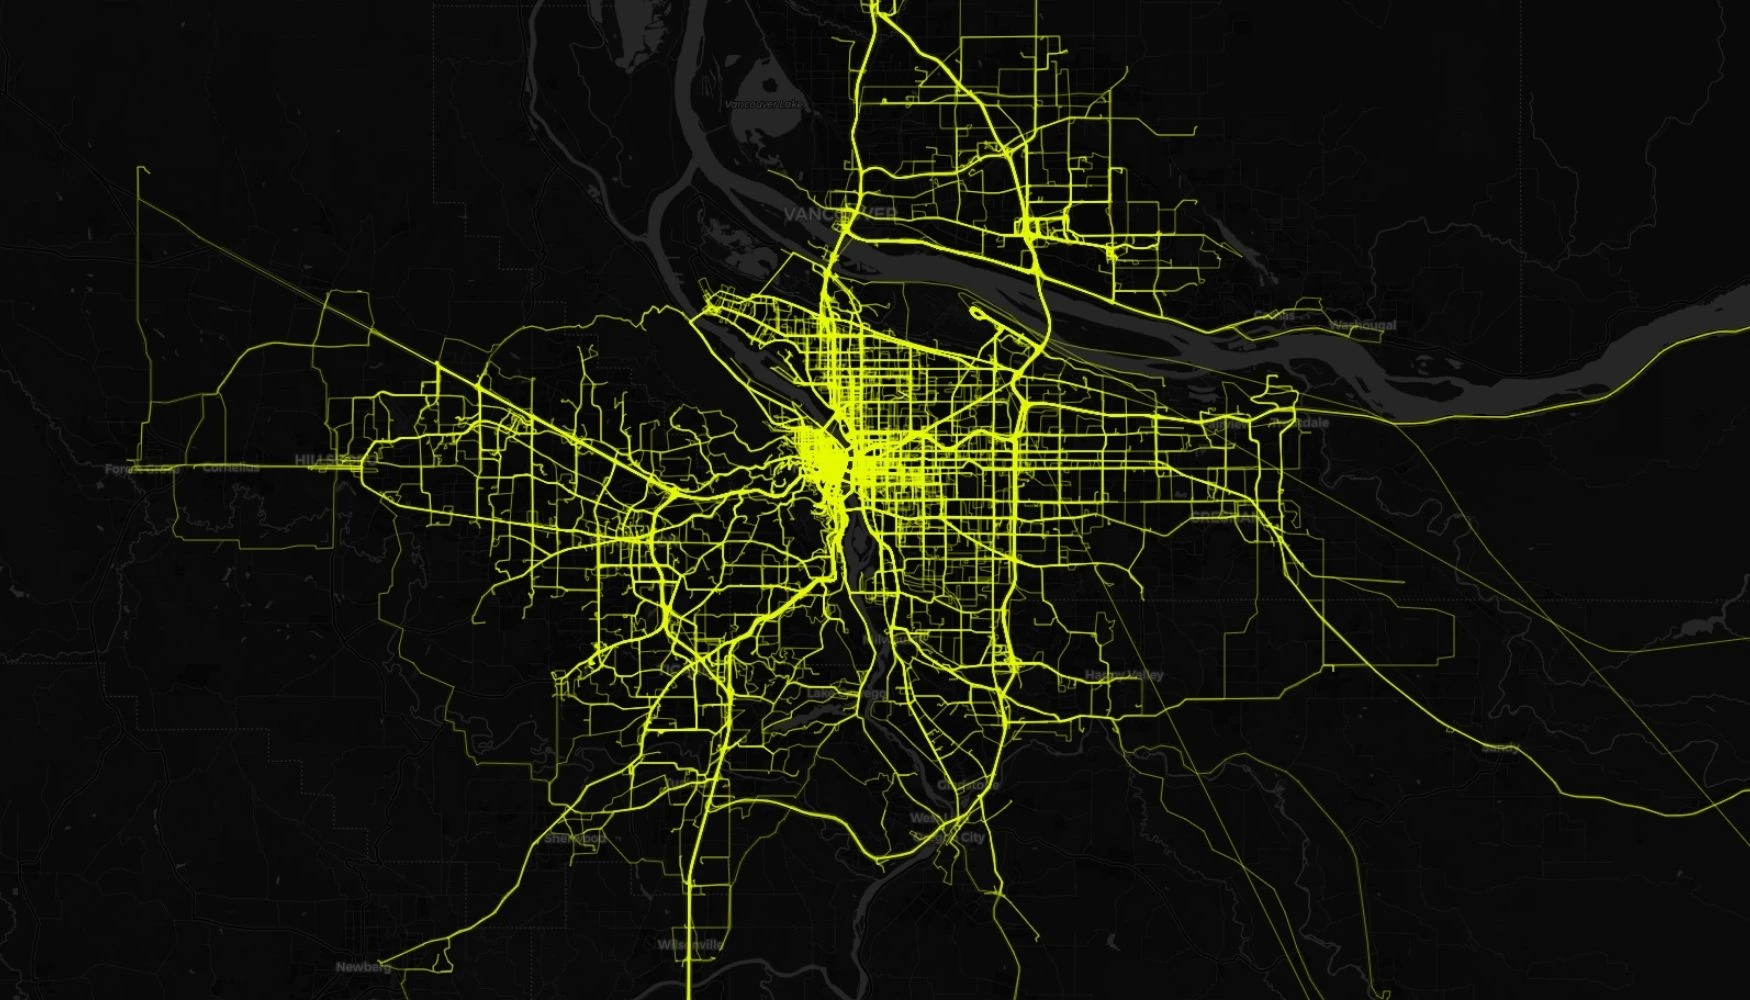
Verified Heatmaps
The consumer receives something of real value — a free ride — which creates immediate goodwill and positive brand association from the moment they accept the offer. It's advertising that people are grateful for.
Campaign Insights
Using anonymized mobile data and regional demographic datasets, we build a clear picture of who encountered your campaign across the markets and zones you targeted — giving you a real read on whether the campaign reached the audience it was built for.
.avif)
Footfall Attribution
We measure whether people exposed to your campaign visited your physical locations — stores, restaurants, or venues — at a higher rate than a comparable unexposed audience. For retail, QSR, and experiential brands, this is the metric that connects street-level exposure to real foot traffic.

Web Lift Attribution
We track whether campaign exposure correlates with increases in direct traffic, branded search, and overall site engagement. When a fleet moves through high-visibility areas, digital behaviour tends to follow — and we can show you the connection.

Common Questions
Everything you need to know about Reporting & Attribution capabilities.
What reporting do I receive on my Wrapped Media campaign?
Every campaign includes GPS-backed reporting with verified heatmap data showing exactly where your fleet travelled. Optional attribution tools add campaign insights, footfall attribution, and web lift attribution tied to your specific campaign activity.
What is verified heatmap data?
Verified heatmap data plots your fleet's GPS data over the course of the campaign, showing exactly which neighbourhoods, event zones, and corridors generated the strongest visibility. It's useful both for evaluating a finished campaign and for planning where to deploy fleet density next time.
What are campaign insights?
Campaign insights use anonymized mobile data combined with regional demographic datasets to build a picture of who was exposed to your campaign across your target markets and zones.
What is footfall attribution?
Footfall attribution measures whether people exposed to your campaign visited your physical locations at a higher rate than a comparable unexposed audience. It's one of the most valuable metrics for retail, QSR, and experiential brands trying to connect OOH exposure to real foot traffic.
What is web lift attribution?
Web lift attribution tracks whether campaign exposure correlates with increases in direct traffic, branded search activity, and site engagement. It gives you a measurable line between physical exposure and digital intent.
Is measurement and attribution available on all campaigns?
Verified heatmap data is included on every campaign. Campaign insights, footfall attribution, and web lift attribution are available as standard add-ons regardless of format, market, or duration.
Is this available for SWARM campaigns?
Yes — and SWARM campaigns are particularly strong for attribution because the geographic concentration of the fleet creates a well-defined zone for measurement. Event audiences also tend to generate stronger lift signals given their higher engagement.
Can I use this data to optimize future campaigns?
Yes. Heatmap and lift data showing which zones, markets, and time periods generated the strongest results can directly inform fleet deployment and market selection for future campaigns.
How much does measurement and attribution cost?
Verified heatmap data is included with every campaign. Attribution tools are available as an add-on — contact us for pricing based on your campaign scope.
Sample Heatmap
Engage with the sample heatmap below to get a taste of our verified GPS reporting.
.avif)
.webp)